The state of alt data · 2026 edition
The month the conversation turned
I pulled every issue of Alternative Data Weekly back to October 2020, parsed out every source I have ever pointed readers at, and asked the pile what changed. It came to 2,600+ sources. Here is what it says.
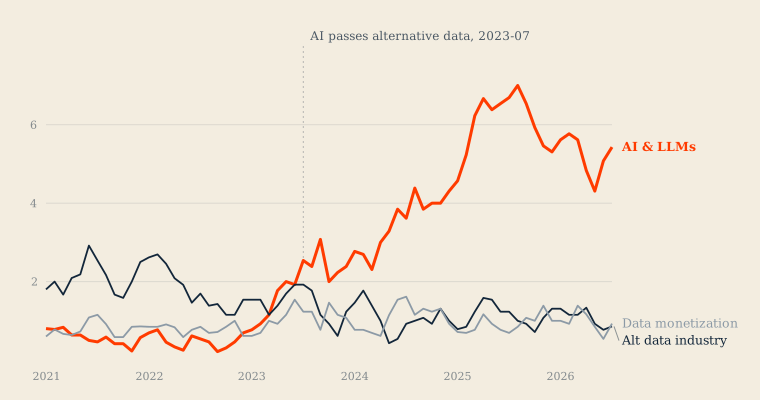
The conversation turned in July 2023
ChatGPT launched on 30 November 2022. AI first edged past alternative data in my citations in April 2023, fell back, and then took the lead for good in July 2023. So it took this industry about five months to notice and seven to commit.
The size of the shift depends on how you count, and I have deliberately used the strictest measure available. If I count only sources with an AI term in the title, which is a deliberate editorial choice by the author rather than a passing mention in my commentary, AI went from 0.25 citations per issue in 2021 and 2022 to 4.64 in 2025 and 2026. That is 18x growth!
The looser measure, counting anything my classifier tagged as AI, gives 11x. I am quoting the smaller-sounding method because it produces the bigger number, which tells you the effect is not an artifact of generous matching.
Over the same stretch the word "alternative" in a source title fell from 0.90 per issue to 0.51.
We did not stop covering alternative data. We stopped calling it that.
The selling never changed. The buyer did.
This is the finding I did not expect. Coverage of data monetization, meaning how firms package, price and sell their data, is as common today as it was five years ago. 78 citations in 2021 and 2022, 79 in 2025 and 2026. Per issue it is slightly up. It is the flat gray line on the chart, and it runs straight through the middle of everything else.
Everything around it moved:
- Marketplaces and data discovery, down 46% per issue. In 2021 this looked like the future of the industry. Catalogs, exchanges, discovery layers.
- Investing and hedge funds, down 12% per issue. The original buyer of this industry's output became a smaller part of the conversation.
- Crypto, from 22 citations to one. An entire adjacent thesis evaporated.
- Data engineering, up 98% per issue. The plumbing got more interesting as the buyer changed.
So the money did not go anywhere. The buyer changed. It used to be a fund hunting alpha. Now it is a company trying to feed a model.
And AI may already have peaked, at least in here
Sources with AI in the title ran at 5.10 per issue in 2025. So far in 2026 they are running at 3.87, a 24% decline and the first time in four years the line has pointed down.
Inside that bucket the composition changed too. Talk of foundation models and LLMs peaked in 2023 at 33 citations and has fallen every year since. Agents went from 4 citations in 2024 to 43 in 2025. The conversation moved from what the model is to what it can do without you.
The people changed as completely as the topics
Almost nobody at the top of my citation list in 2021 is at the top of it now.
| Most cited, 2020 to 2026 | Citations |
|---|---|
| Jason DeRiseThe Data Score | 35 |
| Ben LoricaGradient Flow | 33 |
| Seattle Data Guy | 32 |
| Auren HoffmanSummation, formerly World of DaaS | 30 |
| Mark Fleming-Williams | 27 |
| Matthew Bernath | 23 |
| Benn Stancil | 20 |
| Sven Balnojan | 20 |
Two names appear in every single year since 2021: Ben Lorica and Auren Hoffman. If you have been reading them the whole way too, you chose well.
Method, and what this is not
This measures what I cited, not what the industry did. One curator, one newsletter, every Friday. I think that is a reasonable proxy and it has one real advantage over a survey, which is that it is the same person applying the same judgment for five straight years rather than different respondents each time. But it is a proxy, and you should read it as one.
Sources are tagged against a 21-topic taxonomy derived from the corpus itself. Counts are normalized per issue, because the number of issues varies by year. Creators are resolved by publication domain as well as name, since the same person appears under several spellings across five years of parsing.
Every source behind every number is in the index, searchable by topic, year and publication. If you think I have read this wrong, the raw material is right there.
Next Friday, and every Friday
Alternative Data Weekly
This piece came out of five years of a free weekly newsletter read by 4,600+ people in and around the data industry.