The state of alt data · a sequel
The temperature of the conversation
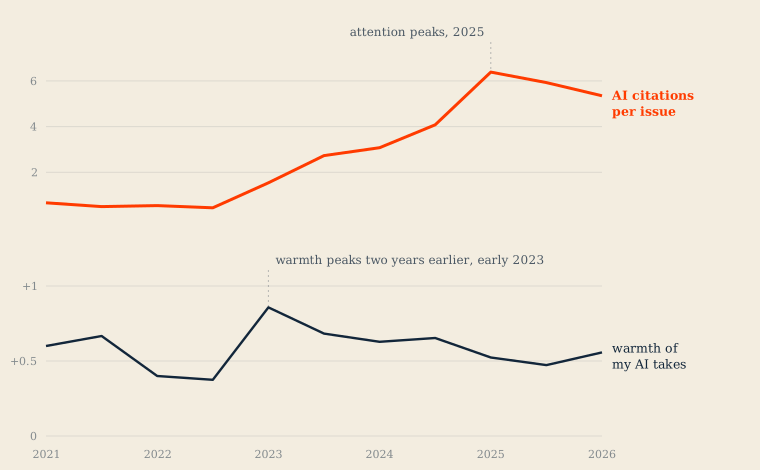
Last month I measured what five years of Alternative Data Weekly cited. This time I measured how it felt. I went back through 396 of my own takes on AI sources and scored each one for warmth toward its subject. The result surprised me: my enthusiasm for AI peaked two years before my attention did.
What I did
The first piece counted citations. Counting tells you where attention went, but attention is not the same thing as belief. So I went back through every take I wrote on an AI source since 2020, all 396 of them, and scored each one by hand: positive, neutral, or negative toward the subject of the piece. Not the writing. The subject. A take that praises an essay while doubting the product it describes scores neutral.
One person wrote every take and the same person scored them, which is the whole point. This is a controlled reading of one curator's temperature, taken weekly, for six years.
The warmth turned in 2023. The volume turned in 2026.
On a scale where +1 is positive and -1 is negative, my average warmth toward AI peaked at +0.86 in the first half of 2023. That was the season after ChatGPT launched, when every week brought something that genuinely had not existed before. From there it slid, half year after half year, to +0.47 in late 2025.
My attention did the opposite. AI citations kept climbing all the way to 2025, when they hit 6.15 per issue and made up more than half of everything I cited. Volume did not turn down until 2026.
So the sequence runs: the wonder faded first, the coverage kept growing for two more years, and only then did the count follow. I was reading more AI than ever at the exact moment I believed it least.
The enthusiasm cooled two years before the volume did.
Cooling is not booing
Here is the part worth being precise about. The slide from +0.86 to +0.47 did not come from negative takes. I wrote 14 negative AI takes in six years. Fourteen. What changed is the ratio of applause to note-taking: in 2023, 76% of my AI takes were positive and 23% were neutral. By 2025 positives were down to 56% and neutrals up to 38%.
I did not turn against AI. I stopped applauding and started filing. That is what maturity looks like in a weekly reading habit: the technology stopped being an event and became infrastructure.
The lead slot tells the other half
The newsletter has a #1 slot every week, and what earns it is a judgment call about importance, not affection. In 2021, AI took 9% of those lead slots. In 2025, at the exact bottom of my warmth curve, it took 62%.
Important and exciting decoupled. AI stopped thrilling me and kept leading the issue anyway, which tells you the story stopped being about wonder and started being about consequence.
Where the warmth lives now
Scoring by sub-topic, the gradient is consistent. I am warmest where AI touches the business I know: AI applied to data monetization runs +0.71, AI and the macro economy +0.67, AI and work +0.65. I am coolest where AI acts on its own or meets the rules: agents run +0.51, regulation +0.51, and the skepticism literature itself +0.47.
Read that as a bias if you like. I read it as experience: the closer a claim sits to something I have personally sold, priced, or shipped, the easier it is for me to tell the real from the demo, and the real stuff earns the warmth.
A footnote about 2022
The coldest year in the whole series is not recent. It is 2022, at +0.39, the year before the boom. The old conversation, big data and machine learning as enterprise slideware, had gone stale, and my takes show it. The euphoria of 2023 landed on dry ground. Worth remembering when someone tells you the current cooling is the end of something: the last cold stretch came immediately before the biggest demand shock this industry has ever had.
Method, and what this is not
This measures one person's posture, not a market. The 396 scored takes are the AI citations that carry commentary; the corpus holds 840 AI citations in total, and takes on non-AI sources are unscored. Negatives are too rare, 14 in six years, to support any bear signal, so read the curve as warmth, not as bull or bear. A curated newsletter is also positively selected by construction: I cite what I think is worth reading, so the floor is high. The scoring rubric is posture toward the subject, not the craft; the first scoring batch ran slightly hot on craft before the rubric was fixed, so allow a few percent of noise. Stance is scored through issue #301; the two issues since are counted in volume but not yet scored.
Every source behind every number is in the index, searchable. If you think I have read my own mind wrong, the raw material is right there.
Next Friday, and every Friday
Alternative Data Weekly
This piece came out of five years of a free weekly newsletter read by 4,600+ people in and around the data industry.