The state of alt data · the good news
The boring part won
Last month I counted what six years of Alternative Data Weekly cited and wrote up what changed. I have been rereading it since, and the finding I underplayed is the cheerful one. The topics that grew are the unglamorous ones. That is exactly what a field looks like when it stops selling itself and starts working.
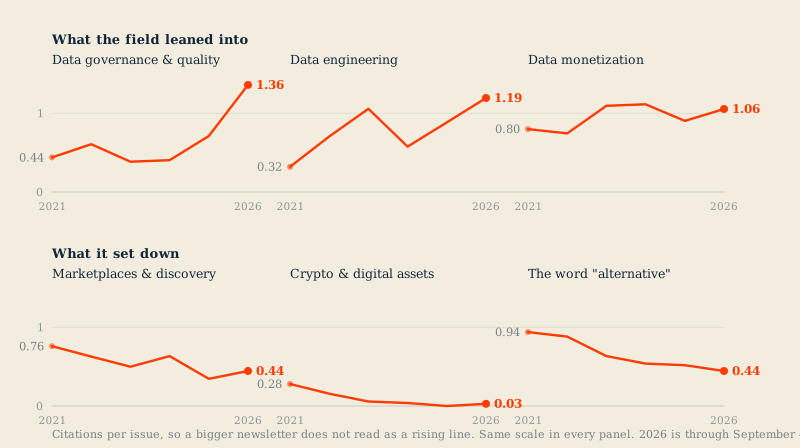
The topics that grew are the ones nobody puts on a conference banner
Data governance and quality ran at 0.44 citations per issue in 2021. So far in 2026 it is running at 1.36, about three times as often. Data engineering went from 0.32 to 1.19, closer to four times. Measured by how much more room they take up in an average issue, those are the two biggest risers in the entire corpus after AI itself.
Neither of them sells a ticket. Nobody has ever been talked into a conference by the promise of a session on lineage. But that is the point. In 2021 this industry mostly talked about what data existed and where to buy it. Now it talks about whether the data can be trusted and whether the pipe holds under load.
Discovery is what you talk about when the work is new. Quality is what you talk about when the work is real.
I noticed this from the other direction last week, putting an issue together around trust and verification and finding that two unrelated writers had arrived at the same conclusion in the same week. That was not a coincidence, and it was not a theme I invented. It has been building in the citations for two years.
The core economics never wobbled
Data monetization, meaning how firms package, price and sell what they have, ran at 0.80 per issue in 2021 and 1.06 today. Last month I called that line flat. Counted properly, per issue, it has actually gained about a third.
Set that against the things standing next to it in 2021:
- Crypto and digital assets, from 0.28 per issue to 0.03. An entire adjacent thesis, and it is now a rounding error.
- Marketplaces and discovery, down more than 40%. In 2021 the catalog was going to be the center of the industry. It became a feature.
So the fashionable adjacent bets came and went, and the plain business of finding data, making it usable and selling it to somebody who needs it did not just survive them. It grew through them. Six years is long enough for that to count as evidence rather than luck.
The field grew its own writers
This is the change I did not see until I looked at where the sources actually live. In 2021, 2.4% of everything I linked was somebody's own newsletter or blog. In 2026 it is 30.8%. Over the same stretch, company and trade sites fell from 66.8% of my sources to 51.1%.
The obvious objection is that I simply found a few writers I like and kept citing them. The data says otherwise. The number of distinct independent publications I cited went from 7 to 55, and concentration went the other way: my ten most-cited domains were 35% of all citations in 2021 and are 20.7% now.
Attention did not narrow onto a few favorites. It spread out across a lot more people. What that means in practice is that the people doing this work now explain it themselves, in public, under their own names, instead of it being explained by whoever had the budget for a content marketing team.
And it is still recruiting
A field that has stopped attracting new voices is in trouble even when its numbers look fine. This one is not close to that. 134 of the sources I cited in 2026 had never appeared in the newsletter before, about a third of the year. Of the 295 writers who show up this year, 221 are new to it.
The hiring conversation moved with it. Coverage of people and careers, which mostly means who is hiring and what they are hiring for, went from 0.22 citations per issue to 0.89, a fourfold rise. Industries in decline do not spend four times as much of their attention on who is hiring.
Six years in, three quarters of the bylines I point readers at every Friday are people I had not cited before. That is not a mature industry closing ranks. That is one still letting people in.
The word is disappearing because the work became normal
The word "alternative" in a source title has more than halved, from 0.94 per issue in 2021 to 0.44. Last month I wrote that we did not stop covering alternative data, we stopped calling it that. I left it there, and it deserves the rest of the sentence.
"Alternative" is a boundary marker. You need a word like that while the thing is still strange, to distinguish it from the ordinary data everyone already had. You stop needing it when the strange thing becomes the normal thing.
Look at what every company building on a model is now doing: finding data nobody organized, working out whether it is any good, making it usable, arguing about what it is worth. That is the job this industry has been practicing since before anyone was watching. The vocabulary is being absorbed because the practice was.
A word that disappears because everyone is doing the thing is not a word that lost.
Method, and the reading that argues against me
The honest counter-reading is available in the same numbers, so here it is. Governance and quality tripling can be read as an industry that still has not solved its quality problem after six years of trying, which is not a triumph. I do not think that is right, because talk about quality tends to arrive with customers strict enough to demand it rather than in its absence. But the data does not settle it, and you should know the same lines support both stories.
As before, this measures what I cited, not what the industry did. One curator, one newsletter, every Friday since October 2020: 2,600+ sources across 306 issues. The advantage over a survey is that it is the same person applying the same judgment for six straight years. It is still a proxy and you should read it as one.
Counts are normalized per issue, because the newsletter itself got bigger, from about 6.7 citations a week in 2021 to 11.8 today. Without that correction every line in here would slope up for no reason. The source-type numbers come from the domain of each link rather than from anything I wrote, so they do not depend on how I happened to word a reading-list entry in a given year.
One thing I checked and set aside: the share of sources carrying a named author rises from 74% to 95% over the same period, which would have been a tidy supporting fact. I could not separate it from a change in how I format the reading list, so it is not part of the argument.
Every source behind every number is in the index, searchable by topic, year and publication. If you think I have read this wrong, the raw material is right there.
Next Friday, and every Friday
Alternative Data Weekly
This piece came out of six years of a free weekly newsletter read by 4,600+ people in and around the data industry.